
Continuing our series digging into the H+T Index, today we highlight what we learned about who uses our most popular tool from a recent user survey.
We received 117 survey responses. While that represents just a fraction of the H+T Index’s regular monthly user base — the tool is accessed more than 2,000 times per month— responses were informative. Before sharing a quantitative snapshot of what we learned, here are a few stories based on interviews with four sets of users.
Measuring progress & sharing work with the public
While H+T does not offer longitudinal data, we have updated the tool with new data periodically. The most recent update was in 2022 using 2019 data. At the Denver Community Planning and Development department, planners are tracking progress toward their Comprehensive Plan goal of reducing cost-burdened households to 35% by 2040, compared to about 44% in 2017 and 40% in 2022.
“The H+T tool is a free, reputable source that measures what we need,” Denver Principal City Planner Courtney Levingston said. “We’re trending downwards towards our target.” She also likes that the data can help her team share a story about progress toward the goal with Denver residents: “We need to tell the community, ‘yes, we are making progress on our policies....’ The H+T index helps us measure and understand where we’re at and where we’re trying to go, and communicate that in data-driven way.”
Validating local findings
North Carolina’s Wake County Planning, Development & Inspections department planners use H+T to address reducing cost-burdened households, as well. The tool shows up in their PlanWake Metrics Dashboard.
Wake County’s Long Range Planning Administrator Sharon Peterson and Senior GIS Analyst Bill Shroyer noted that information from a trusted source can be validating. The H+T tool is “professional, but understandable” Shroyer said—clear and transparent methodology can validate planners’ insights and recommendations with decision makers like county board members and staff.
Equitable planning
From a different perspective, Divya Khandke shared that while at the Washington Housing Conservancy she used H+T data as one of several factors to help screen properties for possible acquisition.
Washington Housing Conservancy is a nonprofit that purchases multi-unit rental properties to "preserve affordability for the long-term in high opportunity neighborhoods," Khandke said. As part of the decision-making around which buildings to purchase, the nonprofit wanted to look at more than just whether the costs and benefits would pencil out.
“My project was to understand the social impact implications and neighborhood amenities of properties in our pipeline,” Khandke said. She created a social impact screening tool that incorporated the H+T tool as well as walk scores, Great Schools, and asset mapping around each prospect that she did herself in GIS and Google Maps, among other sources.
During her time at the Washington Housing Conservancy before taking another position, Khandke was involved in screening 25 buildings, of which 5 were eventually acquired, she said.
A regional perspective; more to do
The Salt Lake City-area Wasatch Front Regional Council metropolitan planning organization, has also been using H+T for several years, said Senior Transportation Planner Julie Bjornstad and Analytics Director Bert Granberg.
Forecasting future costs for housing and transportation is an important goal for the Council they said, and they appreciated the H+T tool’s ability to present a regional picture. “I think it's pretty common for people to have a good understanding of their own neighborhood,” Granberg said. “But helping stakeholders to get a feel for an entire 80-mile-long urban area and the diversity of people and activities, and how well the land uses and transportation infrastructure are serving residents…that's an ongoing challenge in which we hope we can improve.”
They felt the tool could be even more helpful in future with continued regional growth and greater understanding of how transportation fits into housing costs.
We appreciated the feedback from our users! Below, highlights from the survey results.
Main takeaways from the survey results
The survey results confirmed that the H+T Index is useful for its intended audience: urban planners, academic researchers and students, housing and transportation advocates, and consultants. The breakdown of that user base shows that 61% of respondents use the H+T Index for planning or planning and some other use, 43% used it for some academic use, and 29% used it for advocacy alone or with other uses.
Many users focus their attention of a specific geographic region, such as “Boston Region Metropolitan Planning Area data by census block groups” or “Towns/counties in Delaware, Maryland & Pennsylvania“ but there were quite a few that look at larger areas – “Census Tracts, cities, and counties all over the country” or “most major US cities,” while others use it to compare certain areas like “Portland, OR and other west coast markets deemed comparable to our region.”
We asked respondents specifically how they use the H+T Index and received answers from all but 29; these uses vary, but fall into several categories, listed below with a few examples of how it's used, and our reflections on some of those comments:
What is the H+T Index used for?
Planning: 24%
Survey response: “H+T is the only resource we are aware of that provides consistent transportation cost information. One comment is that the use of %AMI misleading at any geography than MSA. We often have to compare the actual cost to a sub MSA geography's median income to get a true understanding of % of income cost. e.g. some counties spend more on transportation than other counties in MSA. However, they have higher incomes so it isn't necessarily burdensome. Having the % of income cost be geography specific would be helpful.”
CNT: We are asked this question about %AMI quite often, and so we wrote a blog about that, check it out!
Survey response: ”The H+T Index is used as a regional performance measure that we track over time.”
CNT: Great, this is the main way we hoped people would use the H+T Index! For more on other ways to use the H+T Index, we wrote another blog about that.
Advocacy: 23%
Survey response: “Southern cities that have a lot of sprawl really need effective messaging tools to illustrate the negative costs of sprawl. This tool does this effectively in a way that other data sources do not.”
CNT: Exposing the inefficiency of sprawl is one of the primary issues we wanted to address. We're so glad the H+T Index can help advance this important concept.
Survey response: “The concept of "30% on housing + 15% on transportation" is now pretty much burned in my mind. "Total cost of housing plus transportation" as a concept is something that I still introduce in policy discussions and keep ever-present in my mind, even if we are not currently using the index itself”
CNT: We wanted this to become part of the way planners/decision makers think about development.
Transportation: 16%
Survey response: “At one time H+T was a critical discussion point as we looked to building up transit networks, highways and roads in our region. Even entered into discussion about land use planning and climate change. It seems not so much anymore as housing affordability has taken center stage and tolling/congestion has risen to become a hot policy topic. DEI is now foremost on land use and transportation planning agendas, shoving aside basic transportation and planning needs including H+T.”
CNT: This is one of the reasons we want to add an additional component that will look at the equity of housing and transportation affordability.
Survey response: “Often use it for initial research into geography of affordability within a transportation planning project area. It's a great tool for starting conversations about where cost-burdened households are living, which costs impact them disproportionately, and as a basis for making the case for the importance of affordable transportation choices.“
CNT: This is great to hear and hope these initial conversations will make it into the planning process as often as possible.
Housing: 10%
Survey response: “We use the information to determine housing cost burden on residents in the state of Florida as part of an annual report we produce.”
CNT: Awesome! We hope the H+T Index will continue to support those efforts!
Survey response: “We use the H+T index and the components of the index as one of the independent or control variables in the model about the affordable housing location and similar issues.“
CNT: So, you are using our modeled data in your models! I think it was Sir Isaac Newton who said, “If I have seen further, it is by standing on the shoulders of giants.”
Academic: 5%
Survey response: “I assign students to explore H+T Index and highlight the often hidden cost of housing costs.“
CNT: We hope they find it useful.
Survey response: “Based my Master's thesis on using the H+T concept and index. The report analyzes spatial patterns of location affordability in Oregon's Metropolitan Planning Areas, evaluates the extent location affordability is incorporated into long range planning documents, and analyses the trends of location affordability in Oregon MPOs.”
CNT: We're so glad to hear the H+T Index has been the inspiration behind academic works and hope the next generation of urban planners bring the concept of location efficiency into their careers and the built environments of the future.
Rural/Urban: 4%
Survey response: “It really helps show the added costs of transportation for a rural area.”
CNT: Indeed, the idea is to make the cost of a rural lifestyle transportation cost more transparent.
Media: 3%
Survey response: “I largely use the combined regional percentage of income that goes to housing and transportation for counties to highlight the high cost of living in areas we write about. To that end, I would love if you could have H+T percentages for states.”
CNT: A good idea for us to consider developing for a future release.
Miscellaneous: 13%
Survey response: “I love the export fact sheets and the various levels of geographic scope that are available. I think there is more available now than when I first used the tool, maybe four years ago.“
CNT: Yes, the fact sheets were a recent addition. We are always looking for ways to make new improvements and additions, and hope the next four years will bring even more!
Survey response: ”Love your website interface, but primarily use the data downloads function as it makes it easier to compare across different geography levels or across the same geography level in many cities.“
CNT: We hoped people would use the data download for just this reason
How often in the past two years have you visited the H+T Index website?
117 total responses
How do you use the H+T Index?
117 total responses
What geographic area(s) have you used the H+T Index to explore?
107 total responses
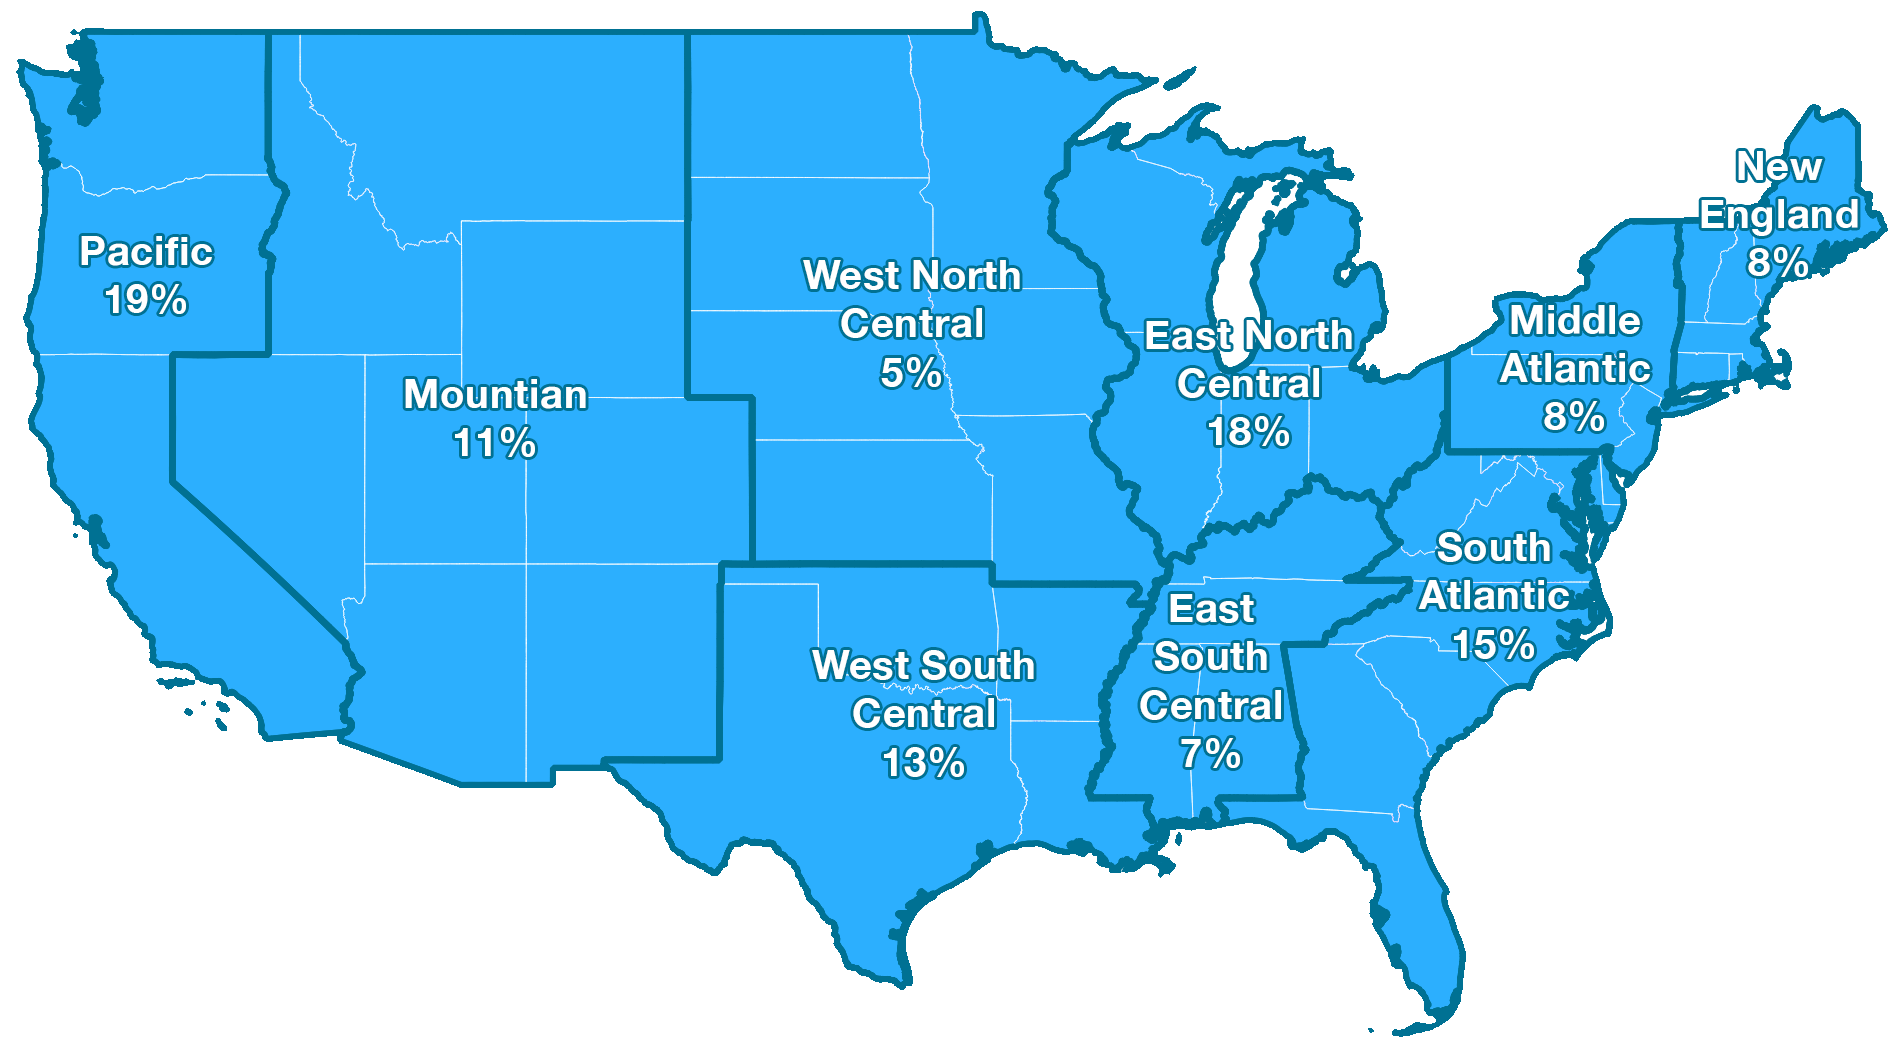
The survey results showed a fairly equal nation-wide distribution of what geographic areas the H+T Index has been used to explore Housing and Transportation costs.
And across the nation, we learned that the range of geographic granularity of "place" ranged from block group (the most precise level of detail) to the entire Nation:
- Block Group (8%)
- Tract (9%)
- County (12%)
- City (11%)
- MPO (2%)
- MSA (7%)
- Neighborhood (3%)
- Zip Code (2%)
- Nation (1%)
On a scale of 1 to 5 with 5 being best, how relevant is the H+T Index to your work?
117 total responses; Average rating: 4.2
On a scale of 1 to 5 with 5 being best, how useful is the H+T Index to your work?
115 total responses; Average rating: 4.0
Summary and Action Items
The survey has given our team that develops the H+T Index some very useful insights. The positive news is that it is widely used by planners, but also by academics and advocates helping to make communities more sustainable and equitable.
On the other hand, we learned that there is a need for more frequent and routine updates of the data, and that looking at how the index changes over time is of great interest. One of the things that strikes me is that we did not hear that users used all of the features available (as presented in a previous H+T blog post), therefore, it might be useful to break the site up into more specific uses, such as a focus on exposing housing and transportation inequities, how the estimates of GHG from transportation varies with the build environment and how the data change over time.
More from our H+T blog series: