
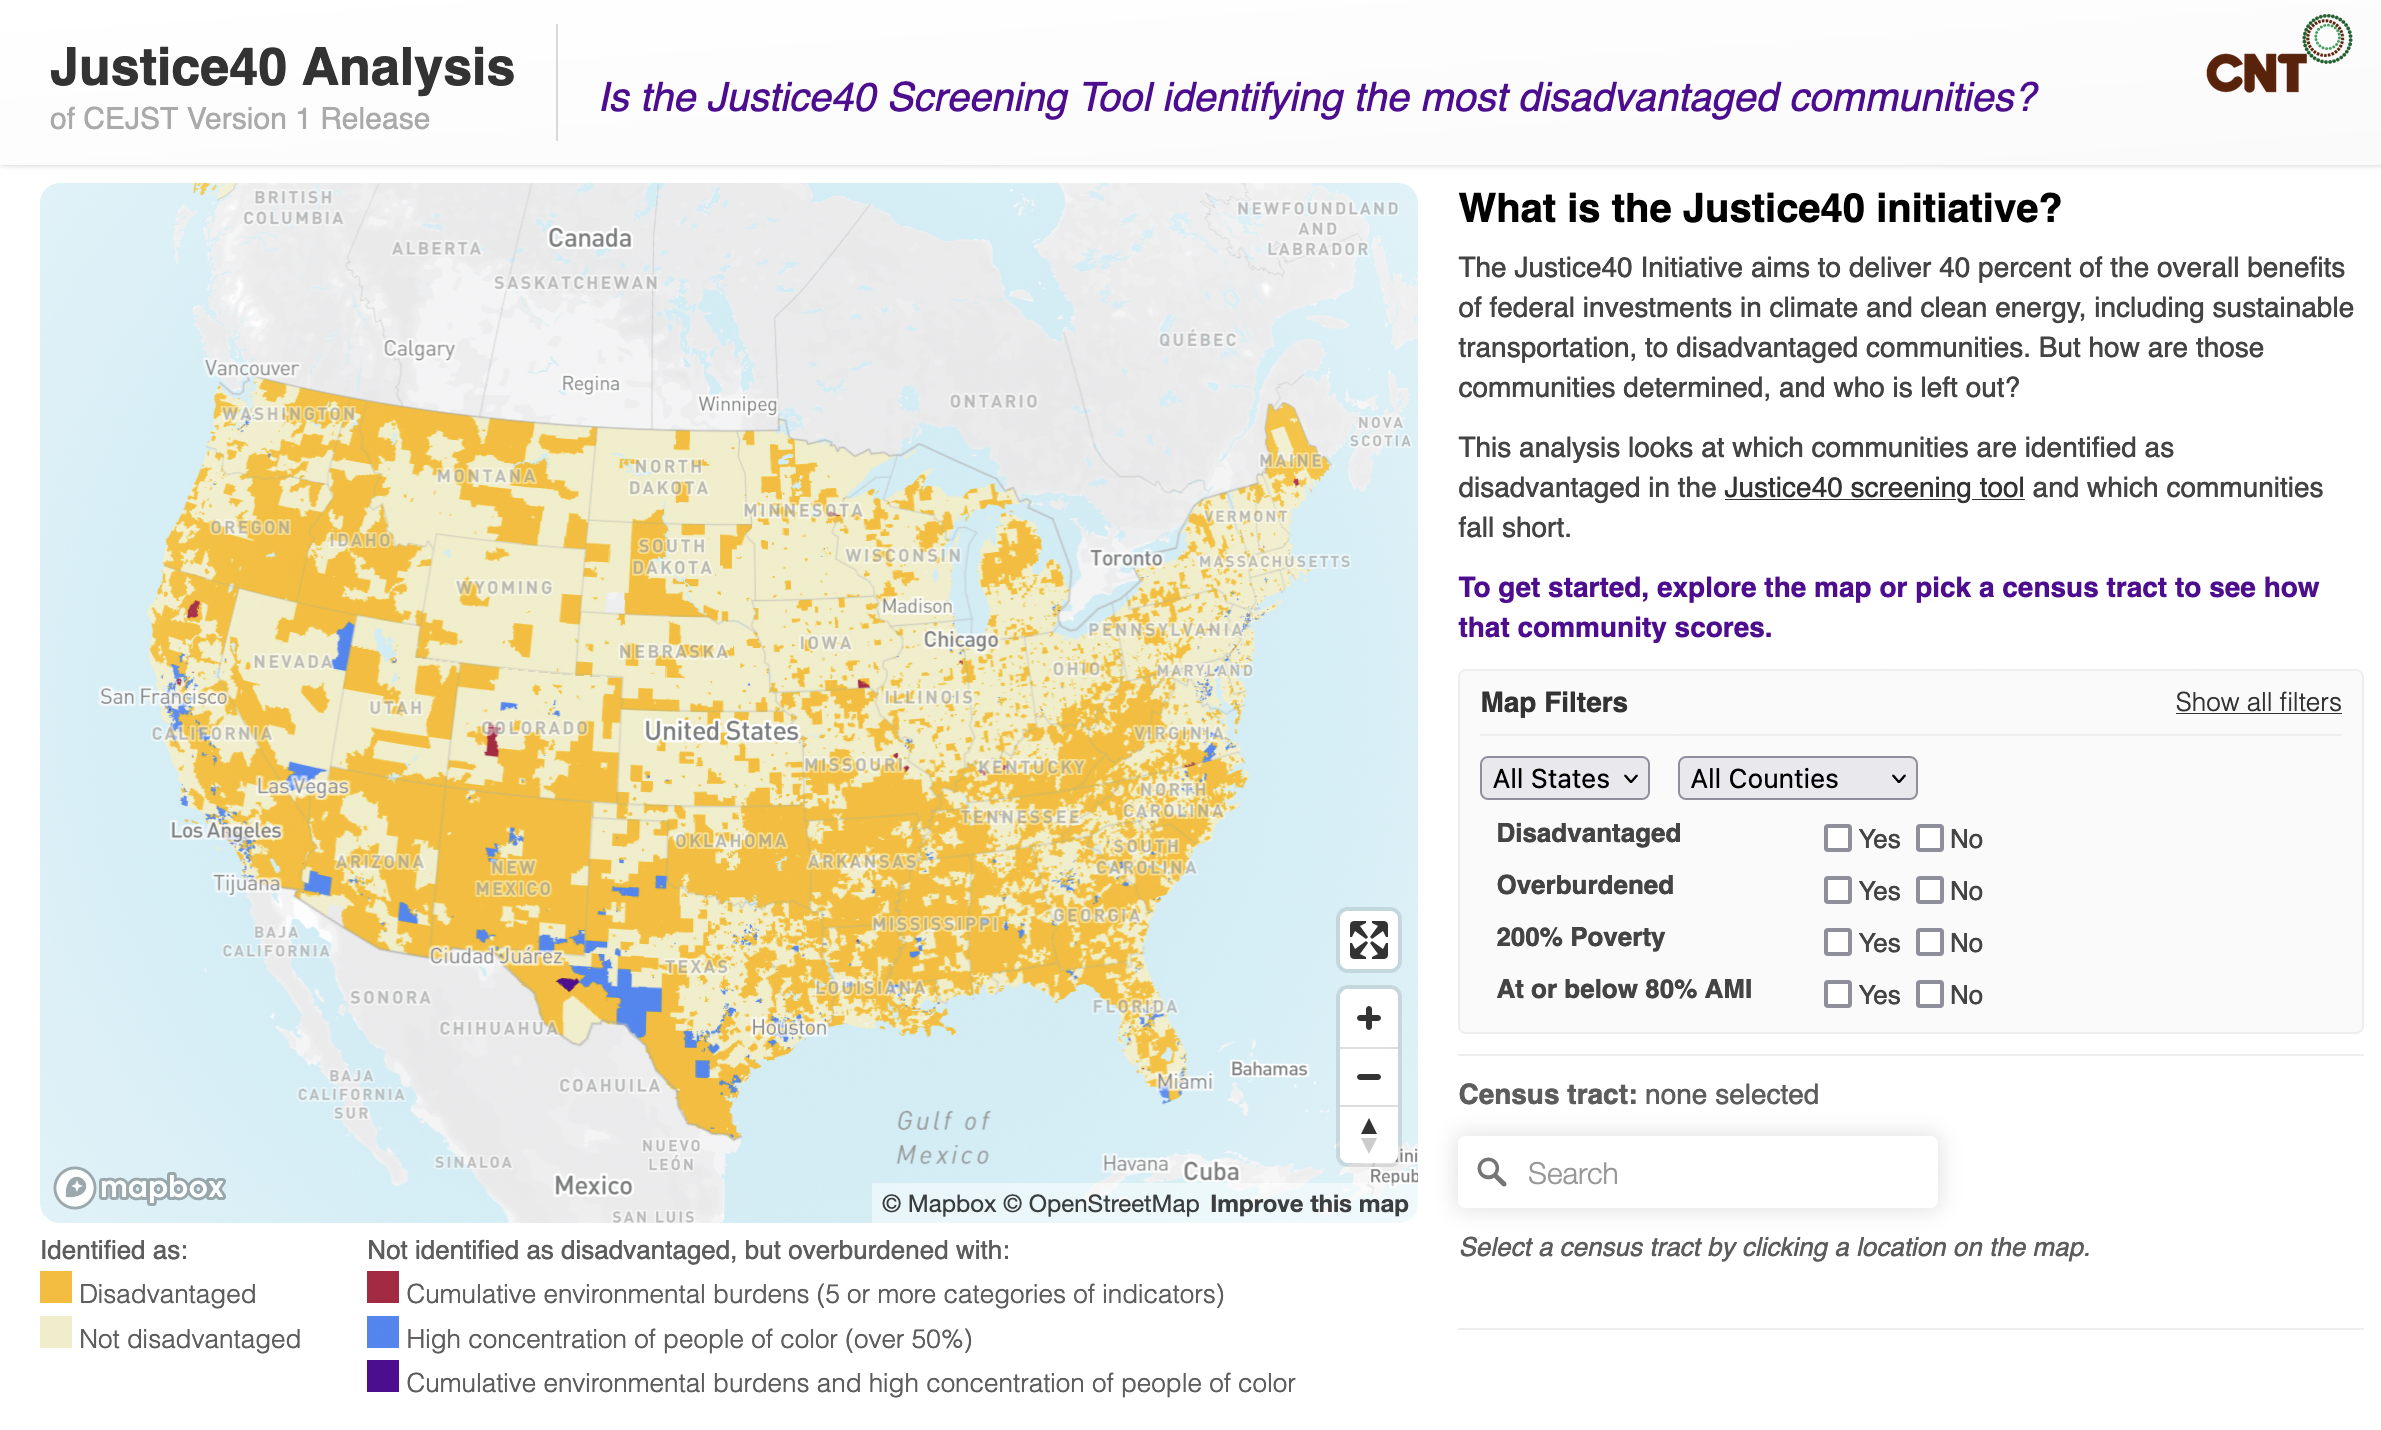
The Climate and Economic Justice Screening tool, or CEJST for short, is a simple map, with big implications. CEJST identifies disadvantaged census tracts for prioritizing federal funding and informing Justice40, which aims to send “40 percent of the overall benefits of certain Federal investments… [to] disadvantaged communities that are marginalized, underserved, and overburdened by pollution.
Over the next five years, federal and state agency staff are charged with doling out billions of federal funds from programs like the Bipartisan Infrastructure Law and Infrastructure Investment and Jobs Act and will be referencing screening tools to inform how to do so. It’s worth noting that CEJST joins the rapidly growing cohort of 30 plus environmental justice tools across state, local, and federal agencies.
Many of these tools are wrapped into policy and responsible for funding allocation. However, CEJST is unique in being the only tool produced by the executive branch, and the sheer amount of dollars it impacts. While tools like CEJST are necessary, their influence and methodologies deserve scrutiny. Small tweaks to percentile thresholds, input datasets, and tool design can drastically alter what communities are defined as disadvantaged.
Under the current version of CEJST, about 37% of the nation’s Census tracts, and 33% of its people, live in places that are considered disadvantaged.
In building the screening tool, the tool’s developers - US Digital Services (USDS) and the Council on Environmental Quality (CEQ) - have lifted a page from the tech industry playbook, adopting a ‘Release, Revise, Repeat’ model (something we applaud and is rare in government tools!). Beta CEJST was released February 2022 and input was solicited through the Justice40 Open Source Google Group, ongoing monthly calls, and formal public comment, (check out EPIC’s and CNT’s public comments). While the process is not perfect, these venues allow for candid and direct feedback. Incorporating input, USDS and CEQ stuck to the tech model and released CEJST v1.0 in November of 2022.
Despite the incremental improvements, the Screening Tool still has progress to make, and we are hopeful they will continue to incorporate feedback as they have done to date. EPIC and CNT have identified four components of CEJST that should be addressed to further advance Justice40 goals:
-
Show data cumulatively: By grouping tracts exceeding only one or two indicators with tracts exceeding ten or more, CEJST misses the distinction between areas with severe environmental and climate burdens and those with moderate burdens. The cumulative hazard burden must be visualized in CEJST like they are EPA’s EJScreen and California’s CalEnviroScreen. Doing so will highlight those most affected by systemic environmental injustices.
-
Revise the economic screening approach: While CEJST stands for Climate and Economic Justice Screening Tool, its overreliance on a single indicator skews the entire tool. Thus, the single economic indicator is essentially as influential as all of the environmental and climate indicators combined. This needs to be revised.
-
Include filters by category: The CEJST interface only shows a specific community's burden categories, rather than communities by a burden category. Viewing the data through filters by category would reveal regional and state trends, and facilitate issue specific advocates to prioritize ‘hotspots’ for investment.
-
Set stronger standards for community involvement and agency guidance: Despite the national coverage of the tool, it falls short in reflecting the inherent regional nuances associated with environmental justice issues. CEQ can continue improving community involvement when refining the tool.
Let’s get into the details.
1. Show data cumulatively.
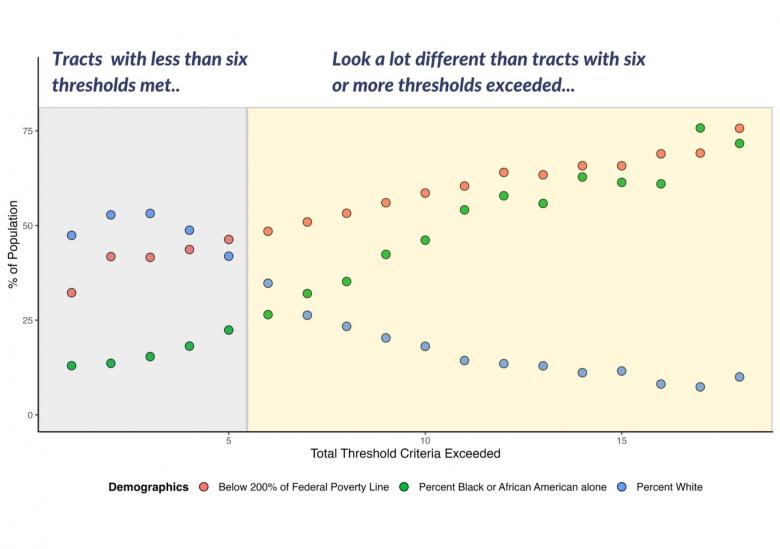
When exploring the CEJST interface, users will note tracts are either categorized as disadvantaged, or not. While a sharp distinction is necessary for some decision makers, in reality there is a spectrum of difficulties communities face. By grouping tracts exceeding only one or two indicators with tracts exceeding ten or more, CEJST misses the distinction between areas with severe environmental and climate burdens and those with moderate burdens. Lower income People of Color, particularly Black residents, shoulder a disproportionate share of environmental burdens. For example, 13% of the US population is Black, but Black residents make up 68% of people living within 30 miles of a coal power plant. Coal plants are just one contaminate source, but the pattern continues for other hazards.
Our CEJST analysis shows tracts exceeding six or more thresholds are on average 52% Black and 62% low income (representing 9% of the total population), compared to only 19% Black and 42% low income for tracts with less than 6 thresholds.
Without showing data cumulatively, the effect of methodology changes and additional indicators on the composition of disadvantaged tracts can be difficult to parse. Despite this, work from WE ACT and CNT has identified a major shift from Beta CEJST to CEJST v.1.0. While the new indicators covered important topics, CEQ and USDS reduced the tool’s focus on the most disadvantaged areas. Why? Because these areas already faced other environmental burdens, and were included in the Beta. The newly added tracts generally did not face other burdens - and therefore fell on the left side of the chart shown above.
This had the effect of watering down the screening tool’s focus:
In the newly added tracts, only 37% of the population are People of Color, who have been shown to face the most severe environmental burdens. This is substantially lower than the share of People of Color in the Beta CEJST (64%) - and even lower than the nation as a whole (40%).
The cumulative hazard burden must be visualized in CEJST like they are EPA’s EJScreen and California’s CalEnviroScreen. Doing so will highlight those most affected by systemic environmental injustices.
2. Revise economic screening approach
While CEJST stands for Climate and Economic Justice Screening Tool, its over-reliance on a single indicator skews the entire tool. CEJST includes one qualifying indicator, the share of people in a Census tract whose incomes are below 200% of the Federal Poverty line. All disadvantaged areas must meet this single threshold indicator to qualify.
Meanwhile, there are 34 environmental or climate indicators, and a tract only needs to meet one of these to quality. And most tracts do - 80% of the nation’s Census tracts meet at least one of these 34 environmental and climate indicators, but still need to meet the single economic indicator in order to be defined as disadvantaged. Thus, the single economic indicator is essentially as influential as all of the environmental and climate indicators combined.
Further, it is uncertain whether the share of population below 200% of poverty is the best measure to use. We analyzed the impact of using an alternative measure - whether the median household income of a Census tract is at or below 80% of Area Median Income (this is a measure commonly used for affordable housing programs).
We found that the majority of disadvantaged Census tracts would qualify under both measures, but a substantial number - about 10,000 tracts in total, representing over 40 million people or nearly 13% of the nation - would have their disadvantaged status change.
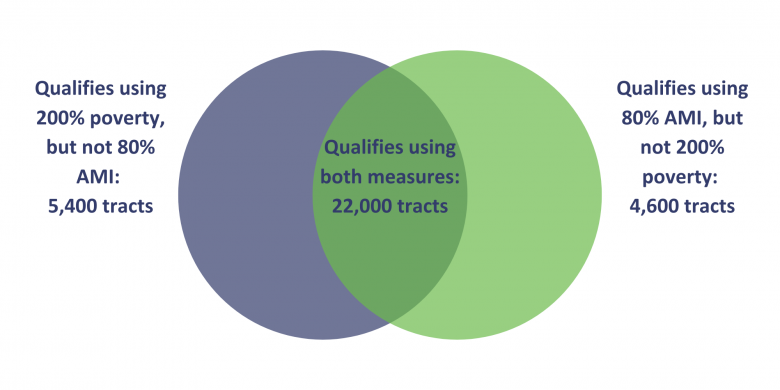
We are not recommending switching this indicator, but instead calling attention to the fact that a reasonable change in the way which income is measured has a meaningful impact in the areas considered disadvantaged.
3. Include filters by category
CEJST is comprised of numerous thresholds and categories. However, the CEJST interface only shows a specific community's burden categories, rather than communities by a burden category. Viewing the data in this way reveals regional and state trends, and facilitates issue specific advocates to prioritize ‘hotspots’ for investment. When looking at the data through a category lens, we can see both artifacts of CEJST’s methodology, and interesting trends across states.
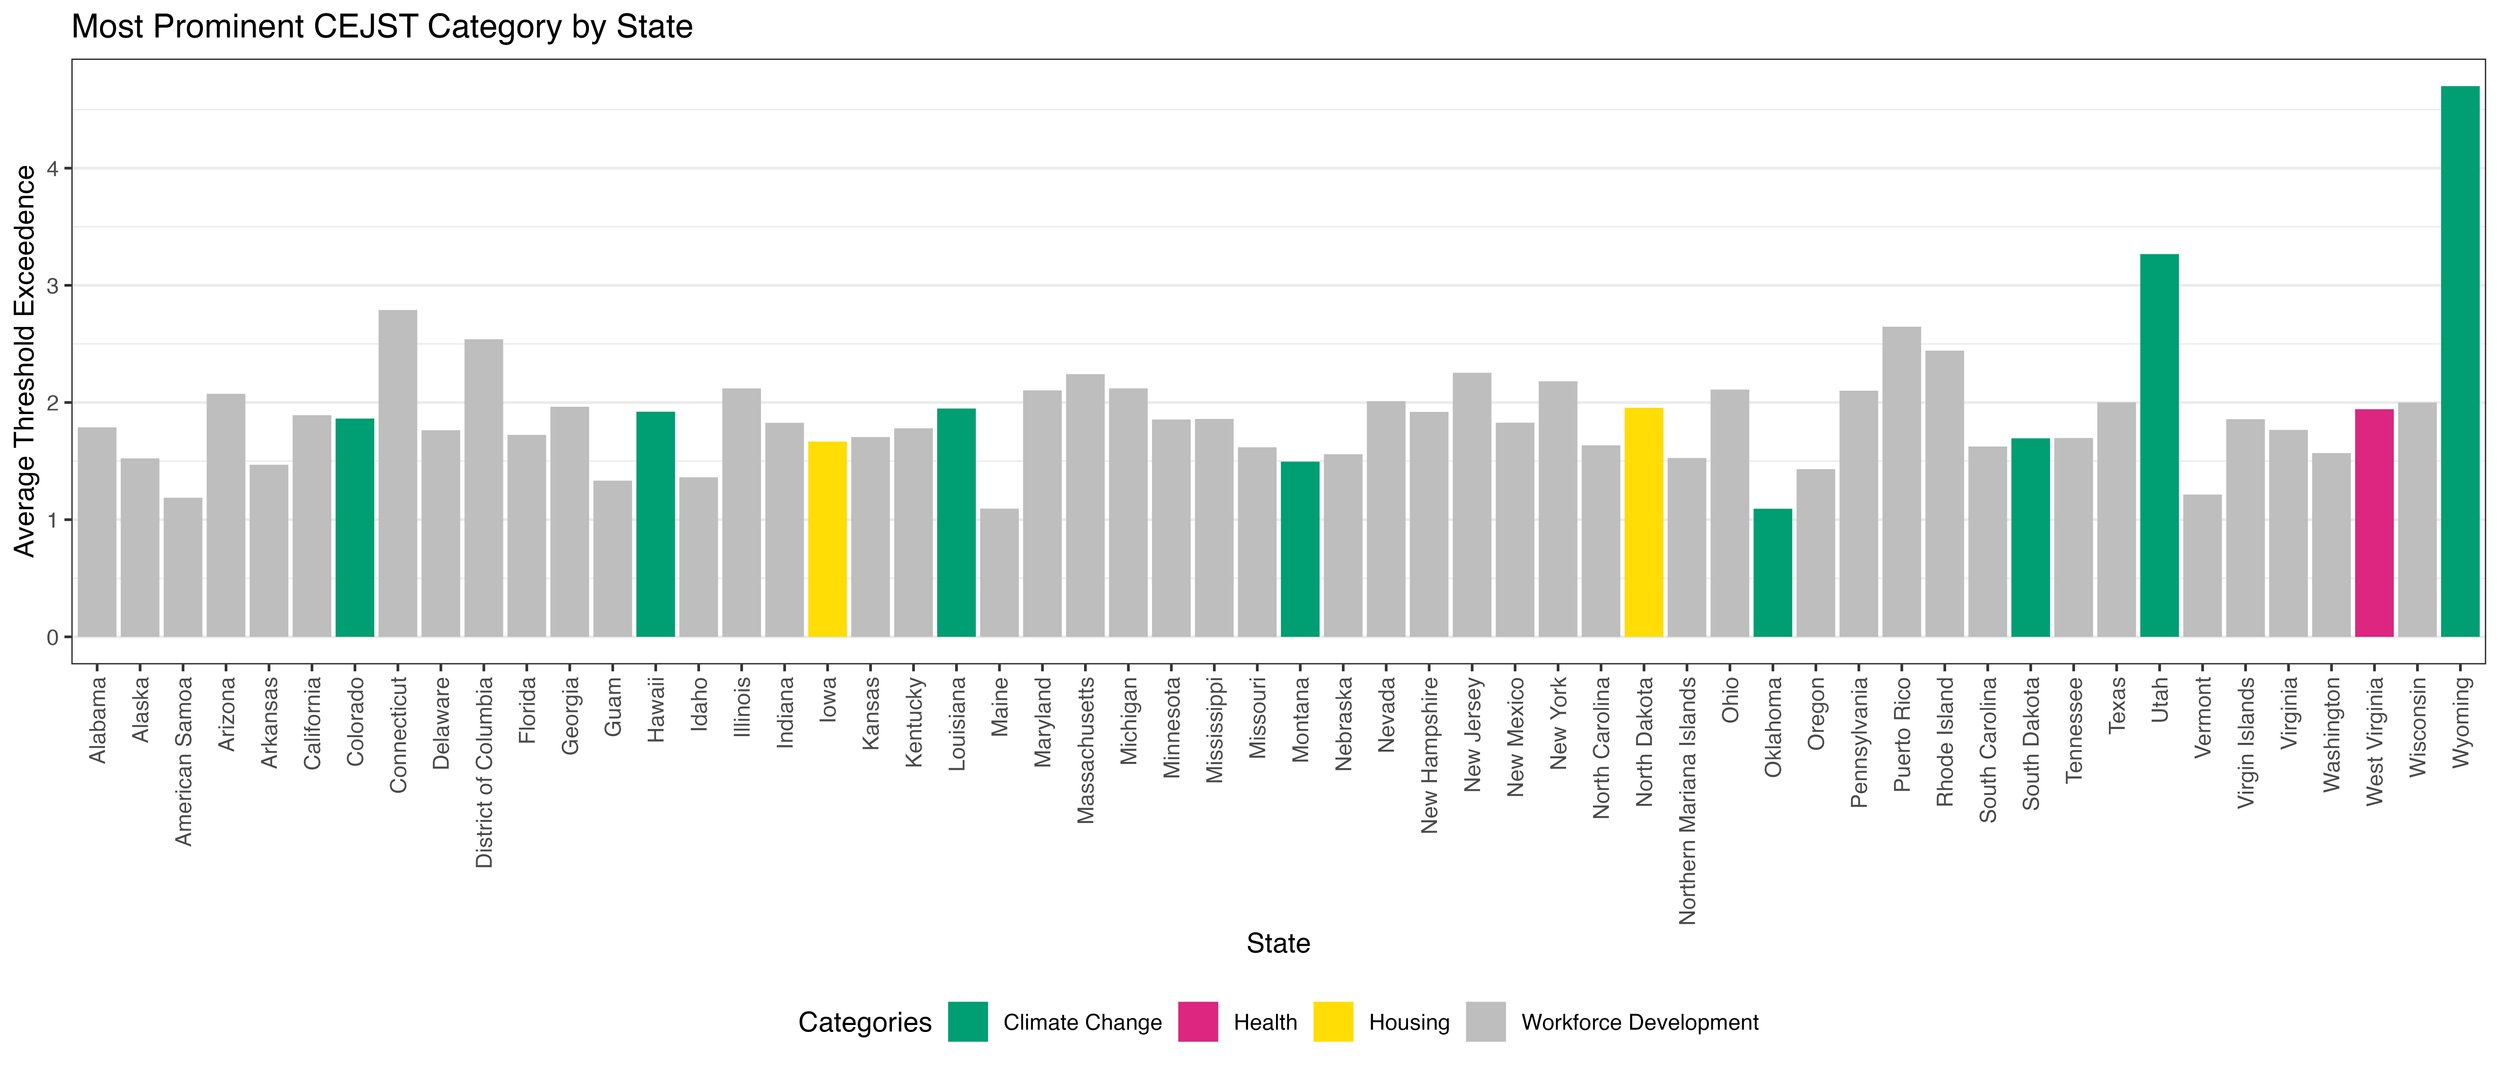
The graph above shows the four most common burden categories (Climate Change, Energy, Health, and Housing), and the average number of thresholds or datasets exceeded. In 80% of states and territories, the single greatest contributor to a tracts' disadvantaged status is Workforce Development. Importantly, this category has the highest composition of People of Color and contains important thresholds like linguistic isolation. However, without category filtering, it obscures categories oriented towards health and the environment.
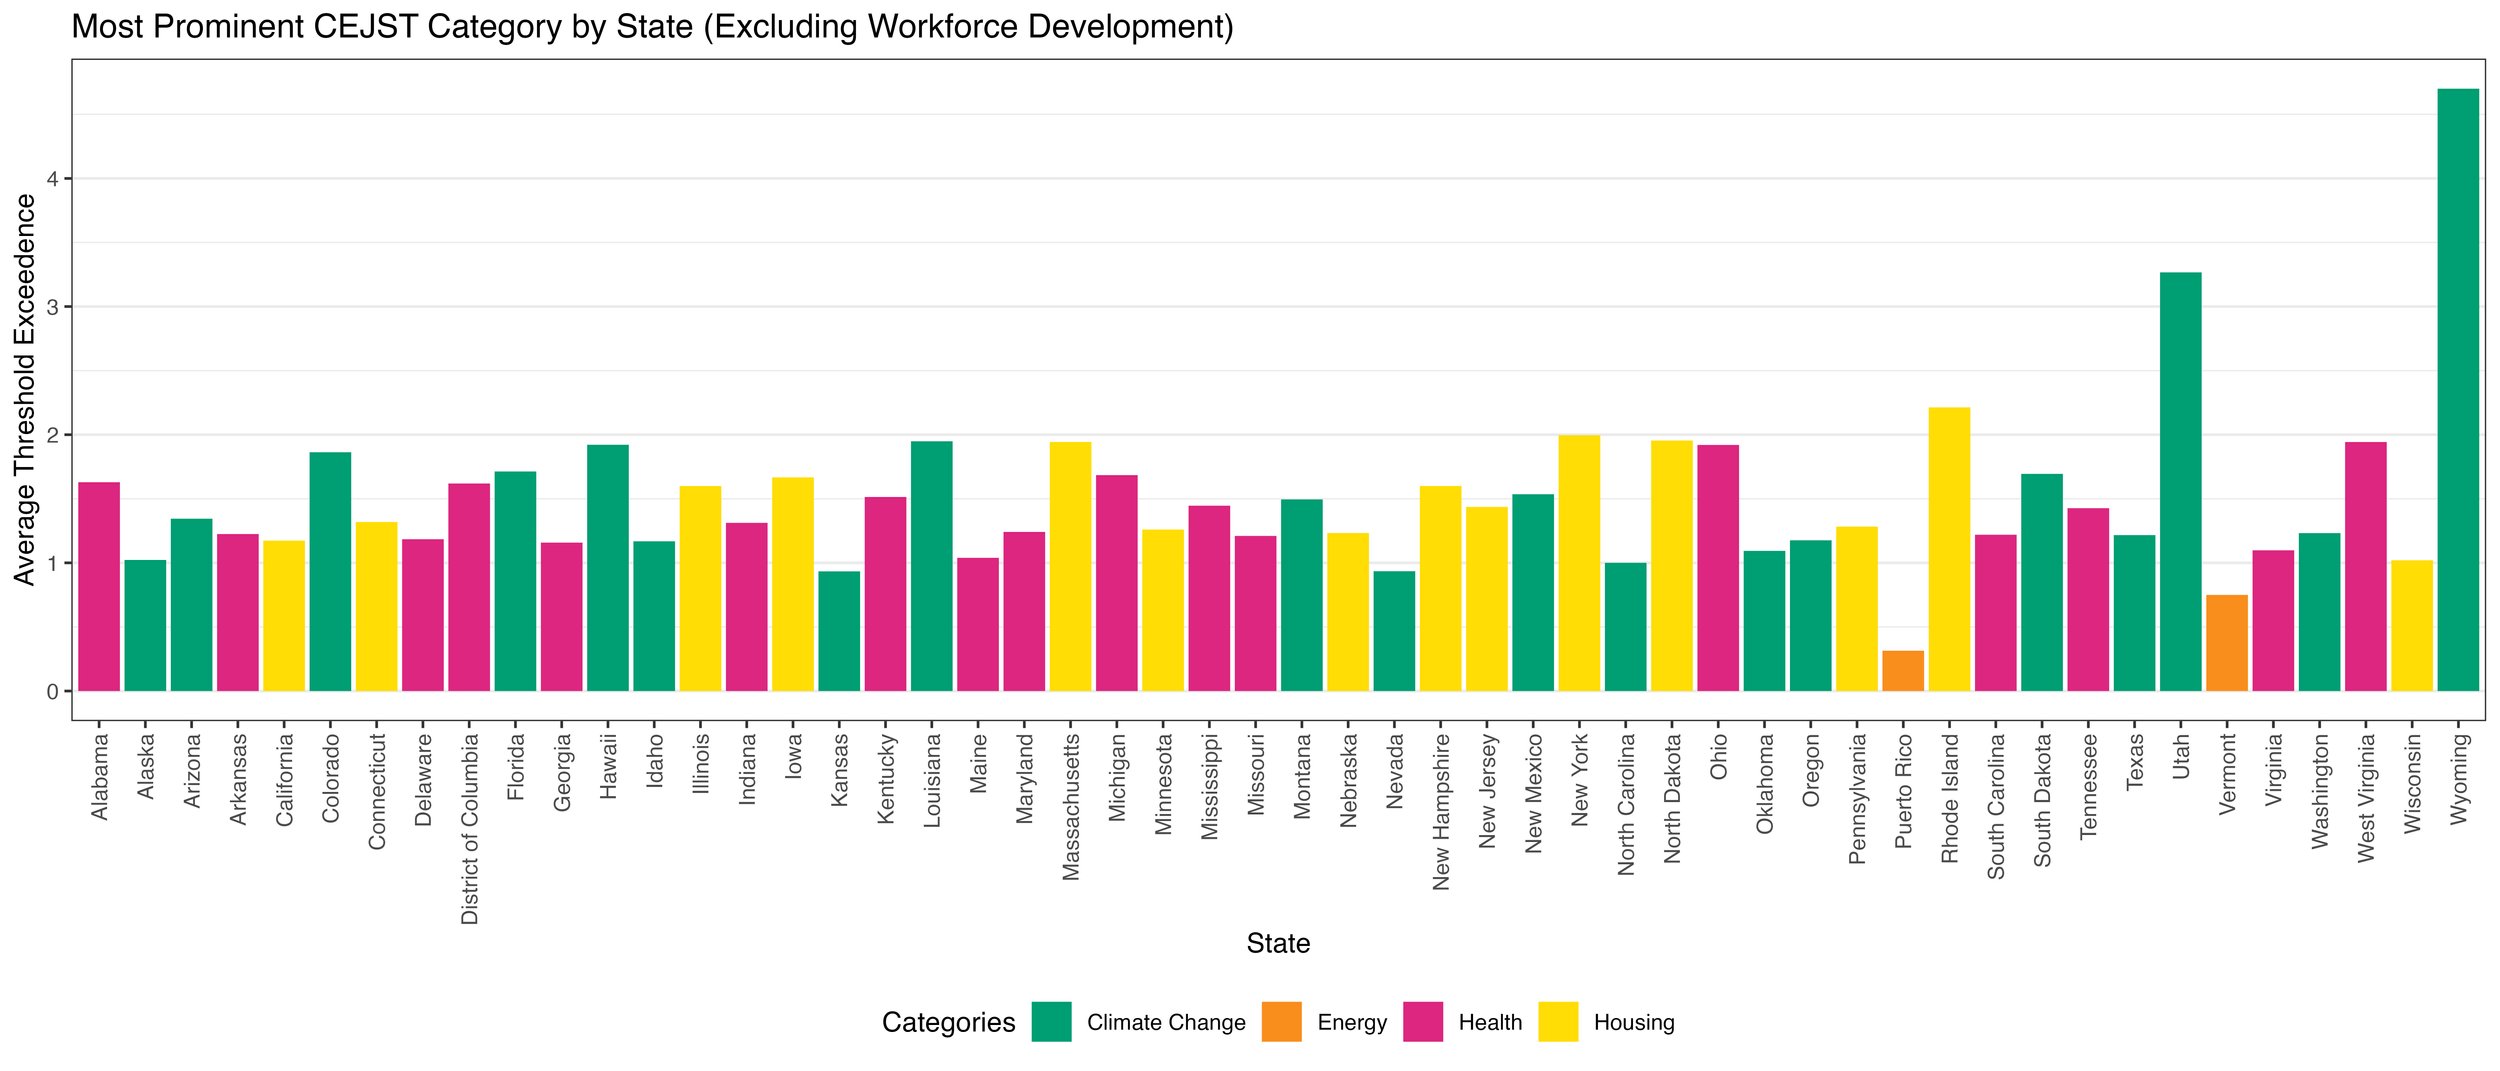
Looking at the data without Workforce Development, we see mountain west states, Wyoming, Utah, and Colorado are impacted by climate change, and Puerto Rico and Vermont face challenges with energy.
More insights can be gleaned from viewing the data in this way, but the current interface of CEJST prevents such an analysis. The Center for Neighborhood Technology has created an interactive map that enables users to filter by category and see more nuanced breakdowns of the data: check out the map here.
4. Set stronger standards for community involvement and agency guidance
Improving the methods and interface of CEJST would move the needle, but CEJST is more than just a tool. When done well, tools like this are a channel for disadvantaged communities to have their voice heard and experience seen by agency staff responsible for funding allocation. Despite the national coverage of the tool, it falls short in reflecting the inherent regional nuances associated with environmental justice issues. While engagement through the Open Source Google Group has been valuable, most environmental justice advocates do not have the time or resources to participate in those sorts of highly technical discussions - they're busy organizing!
Local validation by environmental justice experts who live in the nation’s most burdened communities should be CEQ’s north star. Even adding a ‘self designation’ feature would be significant.
CEQ needs to go further and reach frontline organizations and engage them in tool modifications, compensating advocates for their time and making the processes worthwhile. This can only be done at the local level, not from offices of the White House. If done correctly and with sufficient resources, CEQ could help to set the standard for community involvement in tool development and model best practices for other federal agencies.
On the other side of the equation, CEQ’s CEJST guidance for federal agencies is woefully limited. This eight page document is charged with the monumental task of guiding data analysis to prioritize 40% of federal funding. With inadequate guidance, agency staff are left to develop their own methods. While we believe these individuals are well intentioned and many agencies are already developing additional guidance, there is too much at stake to leave to interpretation. CEQ should develop wrap-around support for agencies. This could look like convenings or webinars, writing additional documentation on when and how to apply CEJST vs. another tool, and facilitating interoperability between federal and state tools for ease of starting with a national picture and narrowing in on region or topic of focus for the end-user.
Concluding Thoughts
CEJST represents a dramatic shift in executive office level policy towards environmental justice. Just five years ago, such a tool from the White House was inconceivable. We applaud the effort, particularly the release, revise and repeat approach. This framework allows for advocates and policy experts to weigh in, improve the tool, and set a new precedent for iterative federal agency technology development that relies on community-centric qualitative and quantitative data.
The next round of improvements should prioritize a cumulative scoring system, revised economic screening approach, filters by category, with better community involvement and agency guidance. By continually making improvements, CEQ and the federal government have broken the mold of static tool development, sending us down the path of steady progress and justice for those we’ve left behind.