
Summary
Two related crises are afflicting US households: increasing housing costs and increasing incidence of eviction. One often overlooked component of these crises is transportation and its costs. This article explores some eviction and transportation data and argues that transportation costs play an integral part in the eviction crisis that affects so many families.
The US is experiencing a housing crisis
The current US housing crisis began in the run-up to the Great Recession of 2008–2009, but has accelerated in the intervening years. As home ownership has declined and more Americans have turned to the rental market, supply has failed to keep pace with this increasing demand.
The result is an ever-tightening rental market, where the overall increase in rental prices has far exceeded the growth in average income. The product is an increasing number of rental households being rent-burdened, where housing costs exceed 30% of a household’s total income (Pew Charitable Trust, 2016).
The difference between the growth in rents and the growth in household incomes is stark. Since 2001, median household incomes have stayed flat while the cost of rent has risen by nearly 50% as of 2010. The chart from Pew below summarizes the trend.
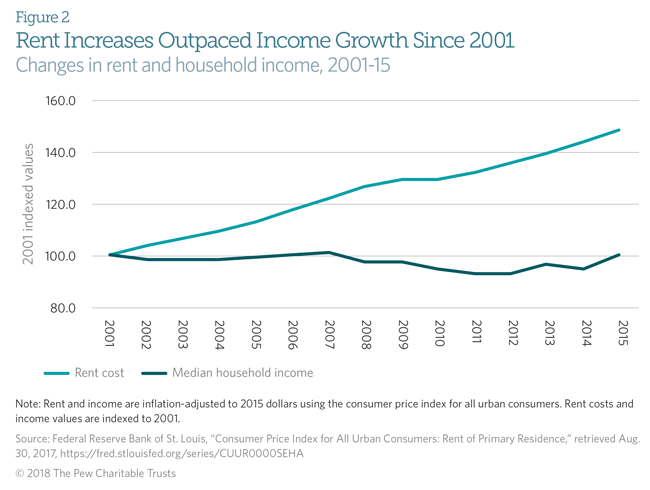
In turn, the share of rental households who are rent-burdened has increased by 19% between 2001 and 2015, from 32 to 38%. The jump in severely rent-burdened households is more striking. The share of rental households spending over 50% of their income on housing has increased by 42% during that same period, from 12 to 17% of total rental households (Pew). Severely rent-burdened households are predominantly lower-income and many spend well more than 50% of their income on rent; at least 1 in 4 spend more than 70% on rent and utilities (Desmond, 2016).
The result is an increasing number of Americans experiencing housing instability and a housing crisis that is bleeding into an eviction crisis.
The US is experiencing an eviction crisis
The Eviction Lab at Princeton University was established in 2017 after Matthew Desmond’s Evicted: Poverty and Profit in the American City shone a spotlight on the impact evictions have on Milwaukee, Wisconsin’s vulnerable populations. Now the Eviction Lab collects and analyzes data from across the country to evaluate the full scope of the eviction crisis. Based on their data, more than 2 million US households receive an eviction notice yearly. Of those, roughly 45% are formally evicted, translating to 1 in 50 renter households receiving an eviction judgment per year.
Unfortunately, these estimates likely underestimate the true scope of evictions in the US. Eviction Lab’s research does not include households that experience informal evictions — households forced to move because of the threat of eviction or due to other factors — and does not include households who have had their eviction records sealed.
Eviction data also shows that evictions are not evenly geographically distributed, as some localities see significantly higher rates than the national average. For instance, in Milwaukee, WI, 1 in 25 renters experience eviction, while in Richmond, VA, eviction impacts 1 in 9 renters (Badger & Bui, 2018).
While geography itself plays a role, as tenant protections and eviction laws vary by state and by locality, poverty may be a more critical factor.
Recent research from Cook County, IL, illustrates that extended stretches of financial instability often precede eviction. Such instability is usually caused by specific events such as losing a job, a health issue, or a car breaking down. Households who receive an eviction filing exhibit signs of increasing financial hardship and instability up to 24 months before the filing (Humphries et al., 2019). The research observed an increase in debt collections and a decrease in credit score in advance of an eviction filing. While the study examines all renters who received an eviction notice, not just those who receive an eviction judgment (i.e., those evicted), similar trends are observable in both groups.
The COVID-19 pandemic has compounded many of the difficulties facing American households and has caused untold economic stress. While various eviction moratoriums have been in place across the country, the impacts of COVID-19 will exacerbate the eviction crisis as soon as the moratoriums lapse, with repercussions felt long thereafter.
Ultimately, eviction and poverty are closely linked. Poverty can cause eviction, but eviction can also cause and perpetuate poverty. To address the eviction crisis, it is critical to address the root causes of financial instability.
Both housing and transportation costs affect eviction
As localities address the housing and eviction crises, it is important to examine all causes of financial instability. Included among these causes are transportation costs. In the summer of 2020, CNT associate board members explored data from the Eviction Lab and the CNT Housing + Transportation Affordability Index. Using statistical tools (R and Python), the team analyzed relationships between eviction rates and variables related to housing and transportation costs.
While the analysis focused on the high-level relationship between housing and transportation costs, our findings indicate that transportation costs are likely to influence a household’s chances of facing eviction.
Specifically, we found that evictions are more highly correlated with combined housing costs and transportation costs than with housing costs alone. In other words, adding transportation costs into our model for eviction increased the accuracy of the model. This is an intuitive result because transportation composes a large portion of household expenses (as we will discuss later).
While examining eviction rates across the largest US urban areas, we also noticed that areas with larger Black populations appeared to have higher eviction rates, and race appears to be an even stronger predictor than poverty rate. Further research is needed, but this is likely due to racist housing policies and practices that have targeted Black Americans for decades, including redlining and land theft.
![]()
In the included graph, eviction rates and transportation costs are plotted with cities’ Black populations. Urban areas with proportionally larger Black populations, such as Atlanta, Detroit, and Washington DC, tend to have higher-than-expected eviction rates. Areas with proportionally smaller Black populations, such as Seattle, Los Angeles, and San Diego, tend to have lower eviction rates. Correlation does not equal causation, but this evidence can serve as a starting point for more in-depth analyses of eviction, transportation, and inequitable housing policies.
Why transportation matters
For most US households, paying for rent or mortgage makes up the largest slice of annual expenses. On average, housing accounts for 33% of household expenditures. The second largest category is transportation at 16%. Even households with multiple children typically spend more on transportation than on food (Bureau of Labor Statistics). Transportation costs disproportionately burden those with lower incomes. US households with low incomes spend nearly 30% on transportation. Meanwhile, similar European households spend 7.5% on transportation (ITDP).
There are many policies and economic processes that contribute to high transportation costs. One of the most influential is the high-cost of car-based transportation. On average, owning and operating one car costs more than $9,200 per year. For households already struggling to pay rent, the cost of driving is a crippling burden (Bureau of Transportation Statistics, ITDP).
By comparison, a year’s worth of unlimited full-fare trips on the nation’s two largest transit systems costs between $1,524 (New York’s MTA) and $1,260 (Chicago’s CTA). While these fares are still too high for many, the costs are exponentially lower than driving.
Why is transportation, and specifically driving, so expensive? One reason is the enormous amount of space it takes to accommodate a single car. A driver needs a place to park their car at home, at work, at the store, and at every other destination. As a result, there are an estimated 1-2 billion parking spaces in the US, or about 3 to 8 spaces for every vehicle (Chester et al. 2011). While drivers may perceive parking as free, the cost of these spaces is built into rent, mortgages, grocery prices, and other costs. Cars are inefficient and expensive to operate in part due to the large amount of space they consume and due to low occupancy (typically 1 to 2 people per car). Walking, biking, and transit are less expensive partly because they require significantly fewer resources to operate. At present, however, communities with safe streets for walking and biking often have expensive housing. One reason for this is that such communities are rare and in high demand.
Car-based urban planning leads to high transportation costs, especially for those families who are already struggling financially. Planning and policies that emphasize walking, cycling, and public transit result in much lower financial burdens. Both housing and transportation are intimately linked to employment opportunities. When cities and other forms of government choose to arrange their land with large residential districts that are miles away from employment centers, they create long, expensive commutes. These policies impact residents’ opportunities to generate income and to have a good quality of life.
Where do we go from here?
Data-driven decision making tools
For planners, elected officials, and advocates interested in potential strategies to address transportation burdens in their communities, CNT has a robust set of resources covering housing, transportation, and economic opportunity.
- CNT’s Urban Opportunity Agenda is an anti-poverty program that outlines the variety of ways in which cities can help address poverty by reducing households’ required expenditures, including transportation costs. Addressing the financial instability households experience requires boosting income opportunities and reducing financial burdens.
- The H+T Index is used by many governments across the country to align housing investment with transportation access. Together with tools like the Equitable Transit-Oriented Development (eTOD) Social Impact Calculator, it can be used to shape public policy and investment.
- Most recently, CNT has formed the Transportation Equity Network in Chicago to involve community-based organizations in embedding racial equity and mobility justice into transportation decisions. This group is inspired by Elevated Chicago, a partnership committed to transforming the half-mile radius around transit stations into hubs of opportunity and connection across our region’s vast transit system.
Moving forward, as cities and towns determine how to better support their residents' housing stability, it is important to examine the local impact that transportation costs have.
The outcome of such an analysis can take many shapes and will depend on a given locality’s transportation infrastructure and housing policies. For example, planners and elected officials in cities with robust public transit can use policy to encourage developers to build housing near transit and employment centers. In cities without robust public transit, the approach might instead focus on the expansion of transit schedules and overall service levels.
Future research on the topics of eviction and transportation could examine the distances that evicted households are required to travel for employment and what those trips look like. Are households who experience eviction less likely to have a car? Are households who rely on cars over transit more likely to face eviction? Or are people who face the highest risk of losing their homes already unable to afford cars? Do changes in transportation circumstances help to precipitate evictions?
Future research could also explore how race affects the relationship between evictions and transportation costs. Racist policies contribute to higher levels of eviction among communities of color, particularly for Black households. In the transportation field, it is well documented that transportation infrastructure is distributed inequitably. How do these two areas of inequity (in housing and in transportation) intersect?
Lastly, additional research is needed to better understand how eviction rates and transportation costs are related. To explore the data used in this article, visit CNT’s H+T Index page and the Eviction Lab website. In future research and in discussions of eviction, we can all start by considering transportation as an integral part of the eviction crisis that affects so many families.
References
“American Families Face a Growing Rent Burden.” The Pew Charitable Trusts, 19 Apr. 2018, www.pewtrusts.org/en/research-and-analysis/reports/2018/04/american-families-face-a-growing-rent-burden.
Desmond, Matthew. Evicted: Poverty and Profit in the American City. Crown Publishers, 2016.
Badger, Emily, and Bui, Quoctrung. “In 83 Million Eviction Records, a Sweeping and Intimate New Look at Housing in America.” The New York Times, 7 Apr. 2018, www.nytimes.com/interactive/2018/04/07/upshot/millions-of-eviction-records-a-sweeping-new-look-at-housing-in-america.html.
Humphries, John Eric, et al. “Does Eviction Cause Poverty? Quasi-Experimental Evidence from Cook County, IL.” The National Bureau of Economic Research, Aug. 2019, doi:10.3386/w26139.
Chester, Mikhail, Arpad Horvath, and Samer Madanat. 2011. “Parking Infrastructure and the Environment.” Access Magazine, 2011.
ITDP. 2019. “The High Cost of Transportation in the United States.” Institute for Transportation and Development Policy. May 23, 2019. https://www.itdp.org/2019/05/23/high-cost-transportation-united-states/.
US DOL Bureau of Labor Statistics. 2019. “Consumer Expenditures 2018.” September 10, 2019. https://www.bls.gov/news.release/cesan.nr0.htm.
US DOT Bureau of Transportation Statistics. 2019. “National Transportation Statistics (Series).” https://www.bts.gov/content/average-cost-owning-and-operating-automobile.