

 Strengthening Transit Through Community Partnerships

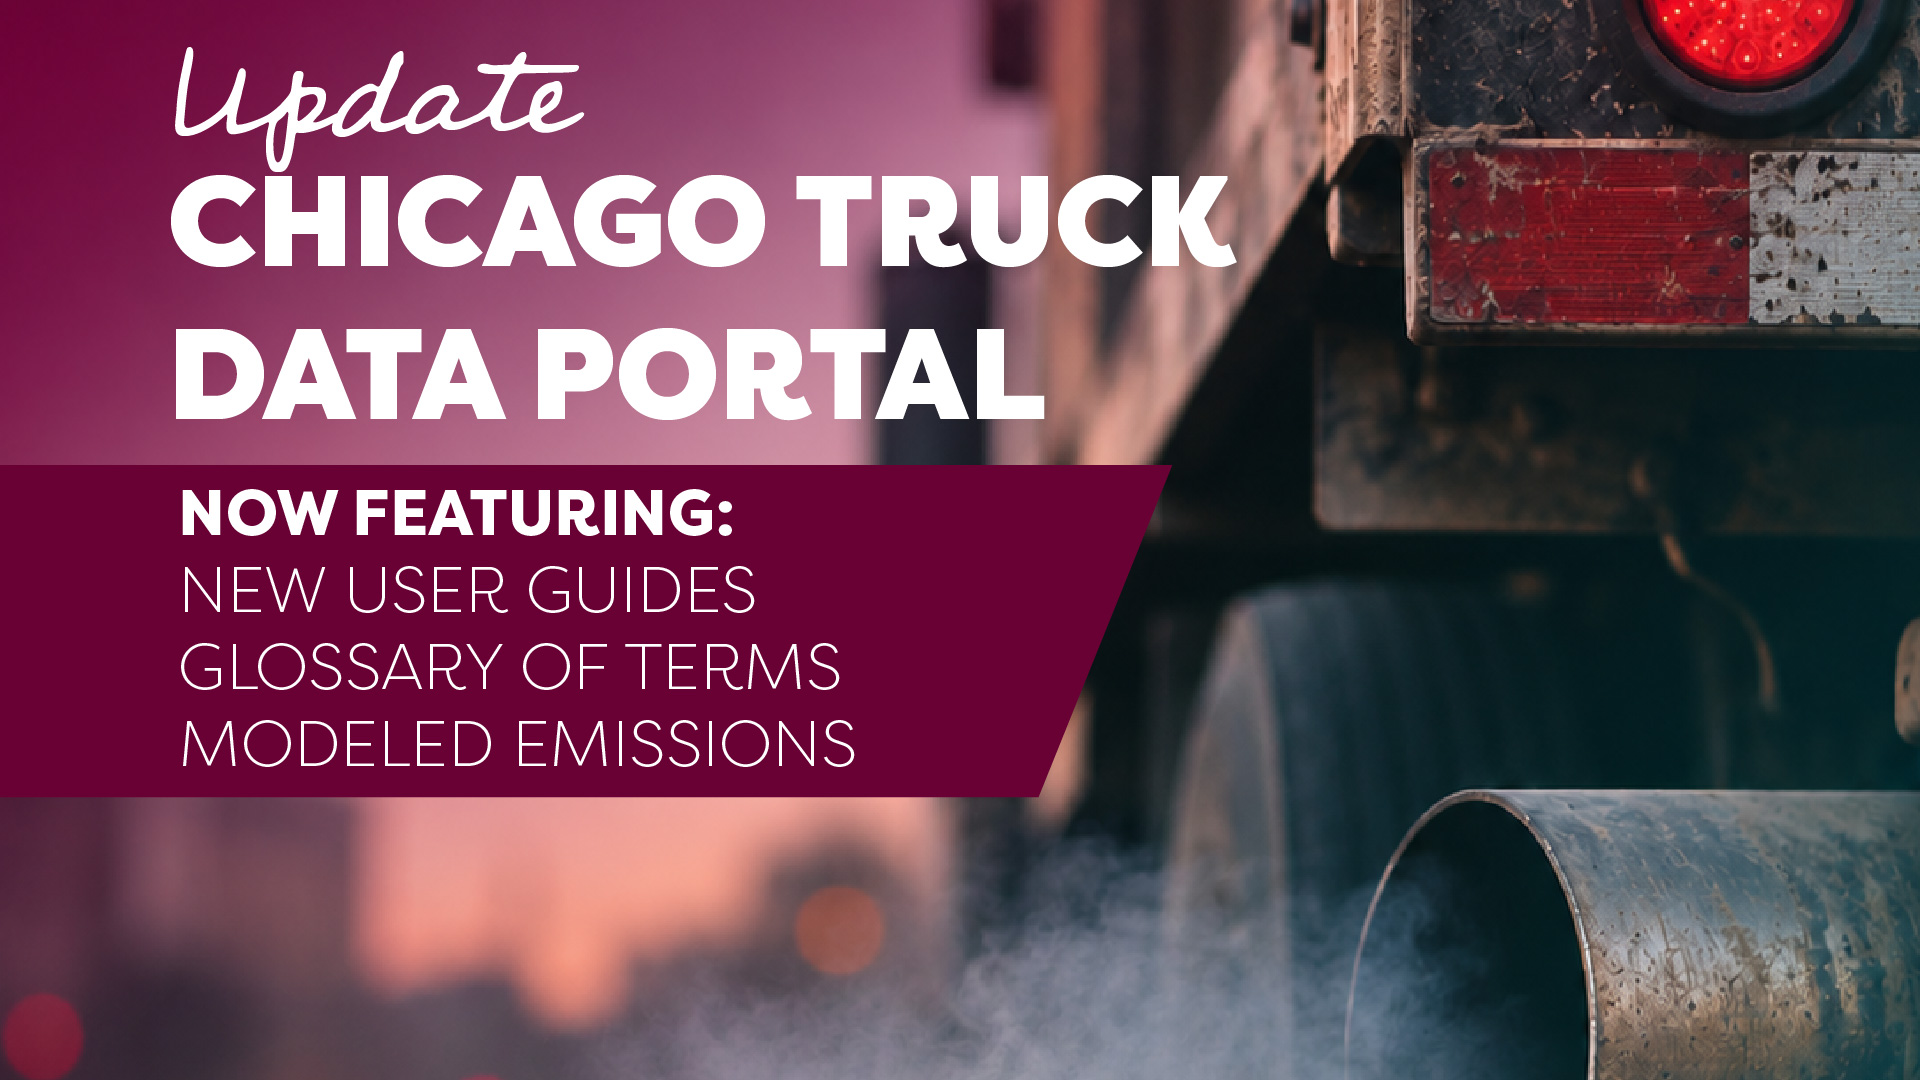
Visit the updated Chicago Truck Count Data Portal →
This November, during National COPD Awareness Month, CNT and the Little Village Environmental Justice Organization (LVEJO) are making it easier for Chicago residents to understand truck traffic and its impact on neighborhood air quality.
Every day, thousands of trucks move through Chicago, delivering goods and supporting the regional economy. But for residents living near industrial corridors, warehouses, and major transportation routes, that movement can come at a significant cost to their health.
Diesel exhaust contributes to air pollution that can worsen respiratory conditions, including chronic obstructive pulmonary disease (COPD), a serious lung disease that makes breathing difficult. According to the U.S. Environmental Protection Agency, exposure to particulate pollution can worsen COPD symptoms and increase the risk of respiratory complications.
During National COPD Awareness Month, we're highlighting how better access to neighborhood-level data can help communities understand the environmental conditions affecting their health and advocate for healthier neighborhoods.
Turning Community Concerns into Actionable Data
For years, residents on Chicago's South and West Sides have raised concerns about the concentration of truck traffic in their neighborhoods.Despite these concerns, detailed information about how many trucks travel through neighborhood streets has historically been difficult to access.
To help close this gap, the Center for Neighborhood Technology (CNT), in partnership with the Little Village Environmental Justice Organization (LVEJO) and Fish Transportation Group, developed the Chicago Truck Data Portal.
The portal provides publicly accessible traffic counts from intersections across Chicagoland, helping residents, community organizations, researchers, and local governments better understand where trucks operate and how traffic patterns may contribute to environmental burdens.
In 2025, the project expanded to include 12 additional intersections selected in collaboration with the Chicago Environmental Justice Network, bringing the total to 47 truck count locations.
Previous findings revealed striking disparities. At 59th Street and Hoyne Avenue in West Englewood, for example, trucks and buses accounted for more than 18% of the traffic recorded during a 24-hour count, substantially higher than the statewide average of trucks comprising 7% of on-road traffic, as reported by earlier research.
These findings reinforce what many residents have been saying for years: communities need better information about the environmental impacts of freight transportation.
Our communities have long known and experienced the impacts of living alongside heavily trafficked freight corridors and industrial facilities. This data helps put numbers to those lived experiences and strengthens our ability to advocate for change. With the addition of emissions modeling, we're building a more comprehensive understanding of the environmental burdens facing fenceline communities. This information is critical to shaping transportation, land use, and environmental policies that prioritize community health and the environment. Ultimately, the goal isn't simply to document these conditions, but to change them. - Carolina Macias, LVEJO
New Tools Connect Truck Traffic to Air Pollution
CNT and LVEJO have continued improving the Chicago Truck Data Portal, adding new resources that make the information more useful, accessible, and actionable.
One of the most significant improvements is the addition of modeled emissions data for all 47 truck count locations. Using traffic count information, the project now provides estimates for three pollutants associated with vehicle emissions:
- PM2.5: Fine particulate matter that can travel deep into the lungs and contribute to respiratory and cardiovascular problems.
- PM10: Larger inhalable particles that can irritate the respiratory system and aggravate existing health conditions.
- Nitrogen oxides (NOx): Pollutants produced during fuel combustion that contribute to harmful air pollution, including ground-level ozone and fine particle formation.
These estimates, calculated using EPA’s MOVES(5), provide a new way to examine the potential pollution associated with vehicle traffic at specific intersections. While modeled emissions are not direct measurements of the air residents breathe or individual health outcomes, they offer additional evidence to inform community discussions and transportation planning.
- The portal also includes several improvements designed to make complex data easier to navigate:
- New bilingual educational resources: A glossary of freight-related terminology and a guide to interpreting traffic reports, both available in English and Spanish.
- An 11-minute video tutorial: A walkthrough explaining how to navigate the portal, access reports, and understand its features.
- Expanded traffic data: Twelve additional truck counts collected in 2025 at locations identified by environmental justice partners.
- Improved user experience: Updated navigation and information, a new section highlighting media coverage, and updated project team information.
Together, these improvements reflect a central goal of the partnership: making technical information accessible to the people who can use it to advance meaningful change.
I kept hearing from advocates how high traffic counts from dirty diesel-fueled vehicles, notably trucks, needs to be more directly tied to impact on public health. CNT listened. Converting our truck and bus counts to their on-road emissions (from tailpipe exhaust to tire wear) is a significant step in this direction. There is no paywall to view this information because CNT believes in equipping any affected resident with the quantitative data they need to further advocate for themselves. - Paulina Vaca, CNT
Better Information for Healthier Neighborhoods
COPD Awareness Month is a reminder that air pollution is more than an environmental concern. It is a public health issue with consequences for people who live, work, learn, and play near busy freight corridors.
In Chicago, these burdens are not distributed equally. Historic land-use decisions and the concentration of industrial facilities have left many predominantly Black and Latino neighborhoods facing overlapping sources of pollution.
Understanding these cumulative impacts is essential to building healthier communities.
By combining community knowledge with accessible transportation data and modeled emissions, the Chicago Truck Data Portal helps residents and community organizations ask important questions about industrial development, transportation investments, and neighborhood health.
The information can support public discussions about freight planning, inform decisions about future industrial development, and help identify opportunities to reduce harmful emissions.
As we recognize National COPD Awareness Month, CNT remains committed to working alongside community partners to ensure that residents have the information and resources they need to help shape decisions affecting their neighborhoods.
Because everyone deserves the opportunity to breathe clean air, regardless of where they live.
Explore the updated Chicago Truck Data Portal to view truck counts, explore emissions estimates, and access new educational resources.