Climate change impacts are felt by individuals and communities all over the world through intense or frequent storms, floods, and increased exposure to air and water pollutants. Who is most impacted by this? Unfortunately, those who are lower-income and have non-white racial or ethnic identities. Chicago’s Southeast Side is one of these communities. Here, residents experience health inequities from their proximity to industrial pollution, like higher rates of heart disease and respiratory conditions than other Chicago neighborhoods.
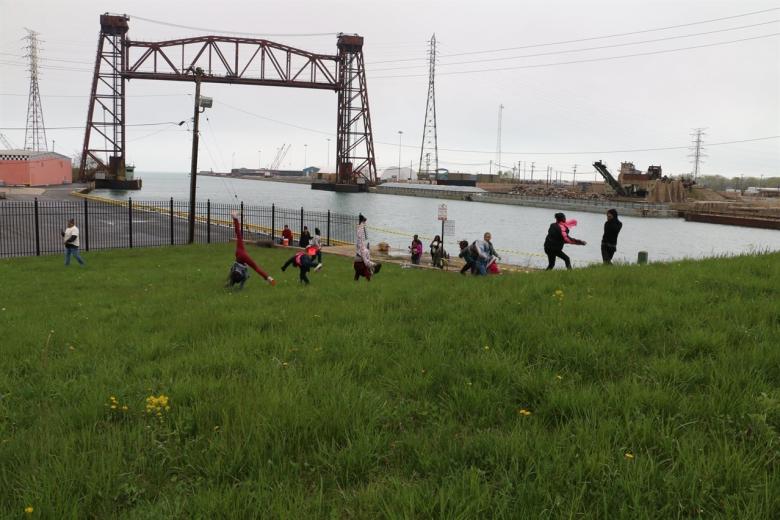
In 2019, CNT was invited to collaborate with the Southeast Side community-based organization (CBO) Southeast Environmental Task Force (SETF). SETF has a mission to ensure an equitable industrial corridor planning process that results in a resilient, healthy, and vibrant Southeast Side. They have worked extensively with coalitions like Calumet Connect on foundational research highlighting inequitable permitting practices, industrial violations, and health inequities. Much of this research is compiled in the Calumet Connect Databook, available at https://greatlakes.org/databook/. As a follow up to this research, CNT worked with SETF to better understand the local climate change hazards (increasing precipitation and rising temperatures) and resulting impacts (poor air quality, urban flooding, and urban heat islands). What follows is an overview of some of our preliminary findings and the data limitations of quantitative analysis without accompanying qualitative data.
Air Quality Impacts
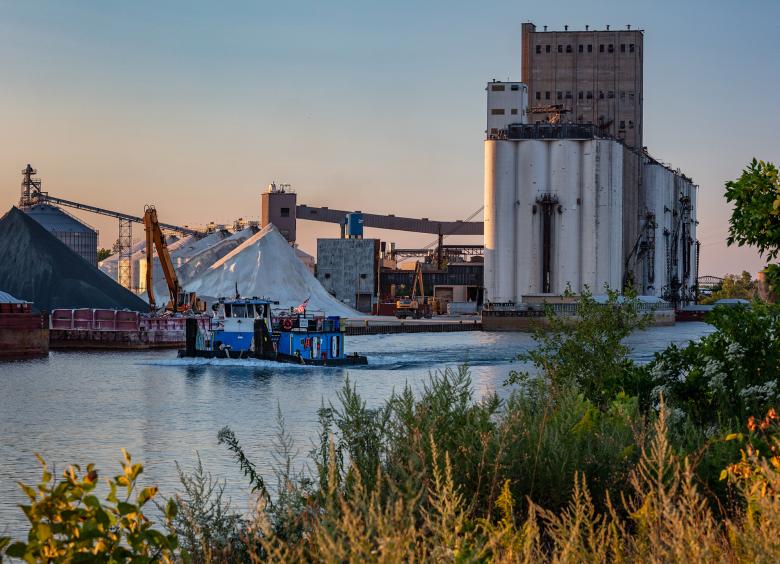
Worsened air quality, urban flooding, and the urban heat island effect are front line climate impacts. Sources of significant air pollution tend to be near low-income communities and communities of color who suffer the health consequences from encroaching industrial pollution. Data from the University of Chicago show that the Southeast Side has more particulate matter (PM) 2.5 pollution than parts of the city away from industrial corridors but less PM 2.5 pollution than industrial corridors on the city’s Southwest Side. Yet, this quantitative or numerical data tell a limited story. For one, the low density of air quality monitors does not provide neighborhood-scale information. Qualitative or narrative data through focus groups and interviews with local residents tell a more complete story. Gathering firsthand accounts reveal significant concerns about hazardous dust, noxious odors, and heavy truck traffic in the Southeast Side.
Urban Flooding Impacts
Urban flooding occurs when local sewer systems cannot cope with high amounts of stormwater. This causes sewage backup in basements and plumbing drains, stormwater seepage and runoff into basements, and excessive amounts of rainwater ponding in yards, streets, and public areas.. Most urban flooding is caused by climate change (heavier rainstorms), aging infrastructure (weak and undersized pipes and sewers), and impermeable land use (land that does not absorb water like streets and parking lots). The Federal Emergency Management Agency’s (FEMA) National Flood Insurance Program (NFIP) identifies where it frequently floods by defining flood hazard areas and flood zones within communities. CNT analyzed this NFIP block group data from 2019-2020 and found that the highest amount of 311 calls (various reports of “water in the street/basement”) came from the Calumet Industrial Corridor. Specifically, in parts of South Deering and East Side; the remaining residential and commercial areas of the Southeast side had a moderate amount of 311 calls. Based on 2016 data on impermeable land cover, the residential and commercial areas of South Chicago, Avalon Park, Calumet Heights, and East Side had the highest proportion of impermeable surface, which leads to higher flood risks.
What this data doesn’t tell us is what the expected future impact of flooding might be on residents if urban infrastructure changes. There are plans to move roads and institute more industrial development, which could exacerbate already bad flooding conditions
Heat Impacts
Environmental justice communities experience the urban heat island (UHI) effect, a phenomenon where cities exhibit warmer temperatures than rural or suburban areas because of a greater extent of paved surfaces, dark roofs, and less vegetation. Low-income and elderly people are particularly vulnerable to UHI because of limited access to parks and air-conditioning and a greater susceptibility to heat related health problems, respectively. One way of predicting UHI effect is through tree cover, which varies considerably across the Southeast Side. This part of the city is home to areas of intense industry with very little tree cover but also large parks bountiful with trees. Residential neighborhoods in the area also vary in tree cover. Despite the Southeast Side having large open green spaces, pedestrian inaccessibility to these spaces withholds trees’ natural cooling properties for resident wellbeing.. CNT derives tree cover and impermeable surface data from satellite imagery at the Census block group level. This data may not represent on the ground realities and can obscure detailed variations in land use. The Southeast Side is a mosaic of vegetative and industrial land cover where the data may not fully capture local weather, microclimates, and heat sources.. CNT confronted data limitations during this project like outdated datasets and conflicting quantitative data with the qualitive insight SETF gathered from residents, This requires ground truthing exercises and community science practices to fill in data gaps, which SETF and CNT are exploring together.
Reconciling Quantitative Data with Lived Experience
Building on this analysis, highlighting hyperlocal climate change hazards and impacts, CNT and SETF will carry out qualitative and quantitative analysis to further understand how climate change impacts aggravate a population already made vulnerable by hyper-industrialization. The quantitative analysis will rely on the Census and other federal, state, and local government datasets for an understanding of the health and socioeconomic characteristics that inform community sensitivities. The qualitative analysis will likely be comprised of surveys, focus groups, long form interviews, and community conversations, and will be informed by and aligned with existing efforts undertaken by SETF and its other partners.
To learn more about SETF’s work, visit https://setaskforce.org.