
CNT’s H+T® Affordability Index has just been updated, the first update since 2016. For most households in the United States, housing and transportation represent the largest and second-largest expenditures respectively. The H+T Affordability Index combines housing and transportation (driving and transit) costs to offer an expanded view of affordability, one that highlights the importance of location-efficient places in supporting livability and affordability.
In this update we recalculate the H+T Affordability Index using more recent data and simplify a few of the inputs while keeping the models robust.
The following data were used in this release:
-
2015 – 2019 American Community Survey 5-Year Estimates (2019 ACS)
-
2019 Longitudinal Employment-Household Dynamics (LEHD) Origin-Destination Employment Statistics (LODES)
-
2019 Consumer Expenditure Survey
-
2018-2019 Transit schedules
-
2019 National Transit Database
-
2018-2020 Odometer Readings from Illinois EPA/DMV
note: the updated H+T Index data will be available for download soon.
Recalibration and Analysis
We initially began by recalibrating the models using the most recent 2020 ACS and 2020 odometer readings; however, we quickly realized that these data would not reveal location efficiency as all prior H+T releases had due to the COVID-19 pandemic impacts on auto use in 2020. When we started exploring the 2020 data, we found that our estimate of household VMT (vehicle miles traveled) was significantly lower than it was in the 2016 release.
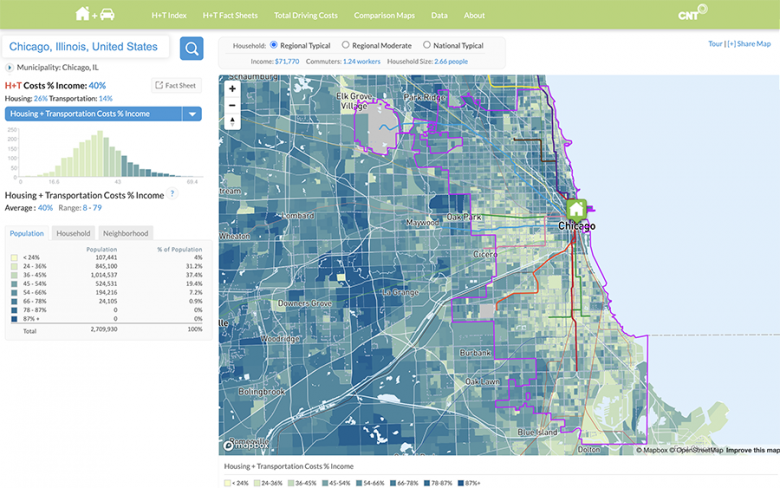
Explore the updated H+T® Index at: htaindex.cnt.org
The Housing and Transportation (H+T®) Affordability Index provides a comprehensive view of affordability that includes both the cost of housing and the cost of transportation at the neighborhood level.
The method we use to estimate annual VMT in a particular year is to take the odometer reading in the preceding year and subtract that from the reading in the following year, so for the 2020 data we used 2019 and 2021 odometer reading and divide that by the number of days between reading, and then multiplying that product by 365 (366 for 2020 – it being a leap year). So, when looking at the difference a large part of the driving was performed during the COVID-19 quarantine, but a substantial length of time was also not during the quarantine. So, estimating household driving for 2020 is at best problematic.
Once we calibrated the VMT model on 2020 data (using 2019 and 2021 odometer reading) and ran it for all the Census Block Groups in the US, we found that there appeared to be a marked reduction in VMT. We were not puzzled for long, recognizing that 2020 and 2021 were in part times when we were all under COVID-19 quarantine, and asked if our job were not essential that we stay home. So, no big surprise that VMT was reduced. And as a result, travel expenditures decreased and therefore affordability improved across the whole country. But how can we disentangle the driving reduction from “Stay at Home” orders and that from the inherent location efficiency of place?
What story does the new data tell?
The 2020 H+T Affordability Index tells an interesting story; however, our goal with the H+T Affordability Index is to supply data that can be compared over time and reflects the state of our built environment (rather than emergency policy interventions). So, we decided that we would run the models for 2019 and provide the user with the data from both 2020 and 2019 as well as the previously released 2016 update (where we used 2015 data) in the download feature.
The few things new with this iteration are that we simplified the transit connectivity index, changed the way we fit everything, using a log-transformation for the VMT and autos/household models and a quasibinomial fit for the percent of transit used in the journey to work model. These changes make the models more robust (more on all this in the methods document online).
What stood out?
Things that stick out to us after updating the data are: Median Income has, in general, gone way up; Housing cost also went up but not as much as median income. Transportation costs have also gone up, but at a rate that is less that income, such that the national average transportation cost as a fraction of income (for the regional typical household) went down by about 5%. So, in general, places look more affordable overall; however, the trend of compact urban neighborhoods as more affordable than those in more remote areas continues. We hope that everyone will dig into the new data and discover how location efficiency continues to play a large role in housing and transportation affordability.
We have been thinking about how life is different for many of us now vs. 2019. The 2019 data are the more constant state of the built environment allowing for past comparisons. We know that housing and transportation costs have increased in the last year, especially, and that coming out of the pandemic folks have changed their travel behavior. How will all this change the landscape of affordability? That question is for future updates and research.
What's next?
Finally, we know that there is so much more that can be done with the H+T Index. Questions like: how can we explore how location efficiency affects affordability for people of color, and low-income populations and how can the index be used effectively to create more equitable communities? It is questions like these and a myriad of others that you, the community of users get to dive in, explore and hopefully address!
Questions about the H+T Index and the update can be sent to CNT's Director of Urban Analytics Preeti Shankar.